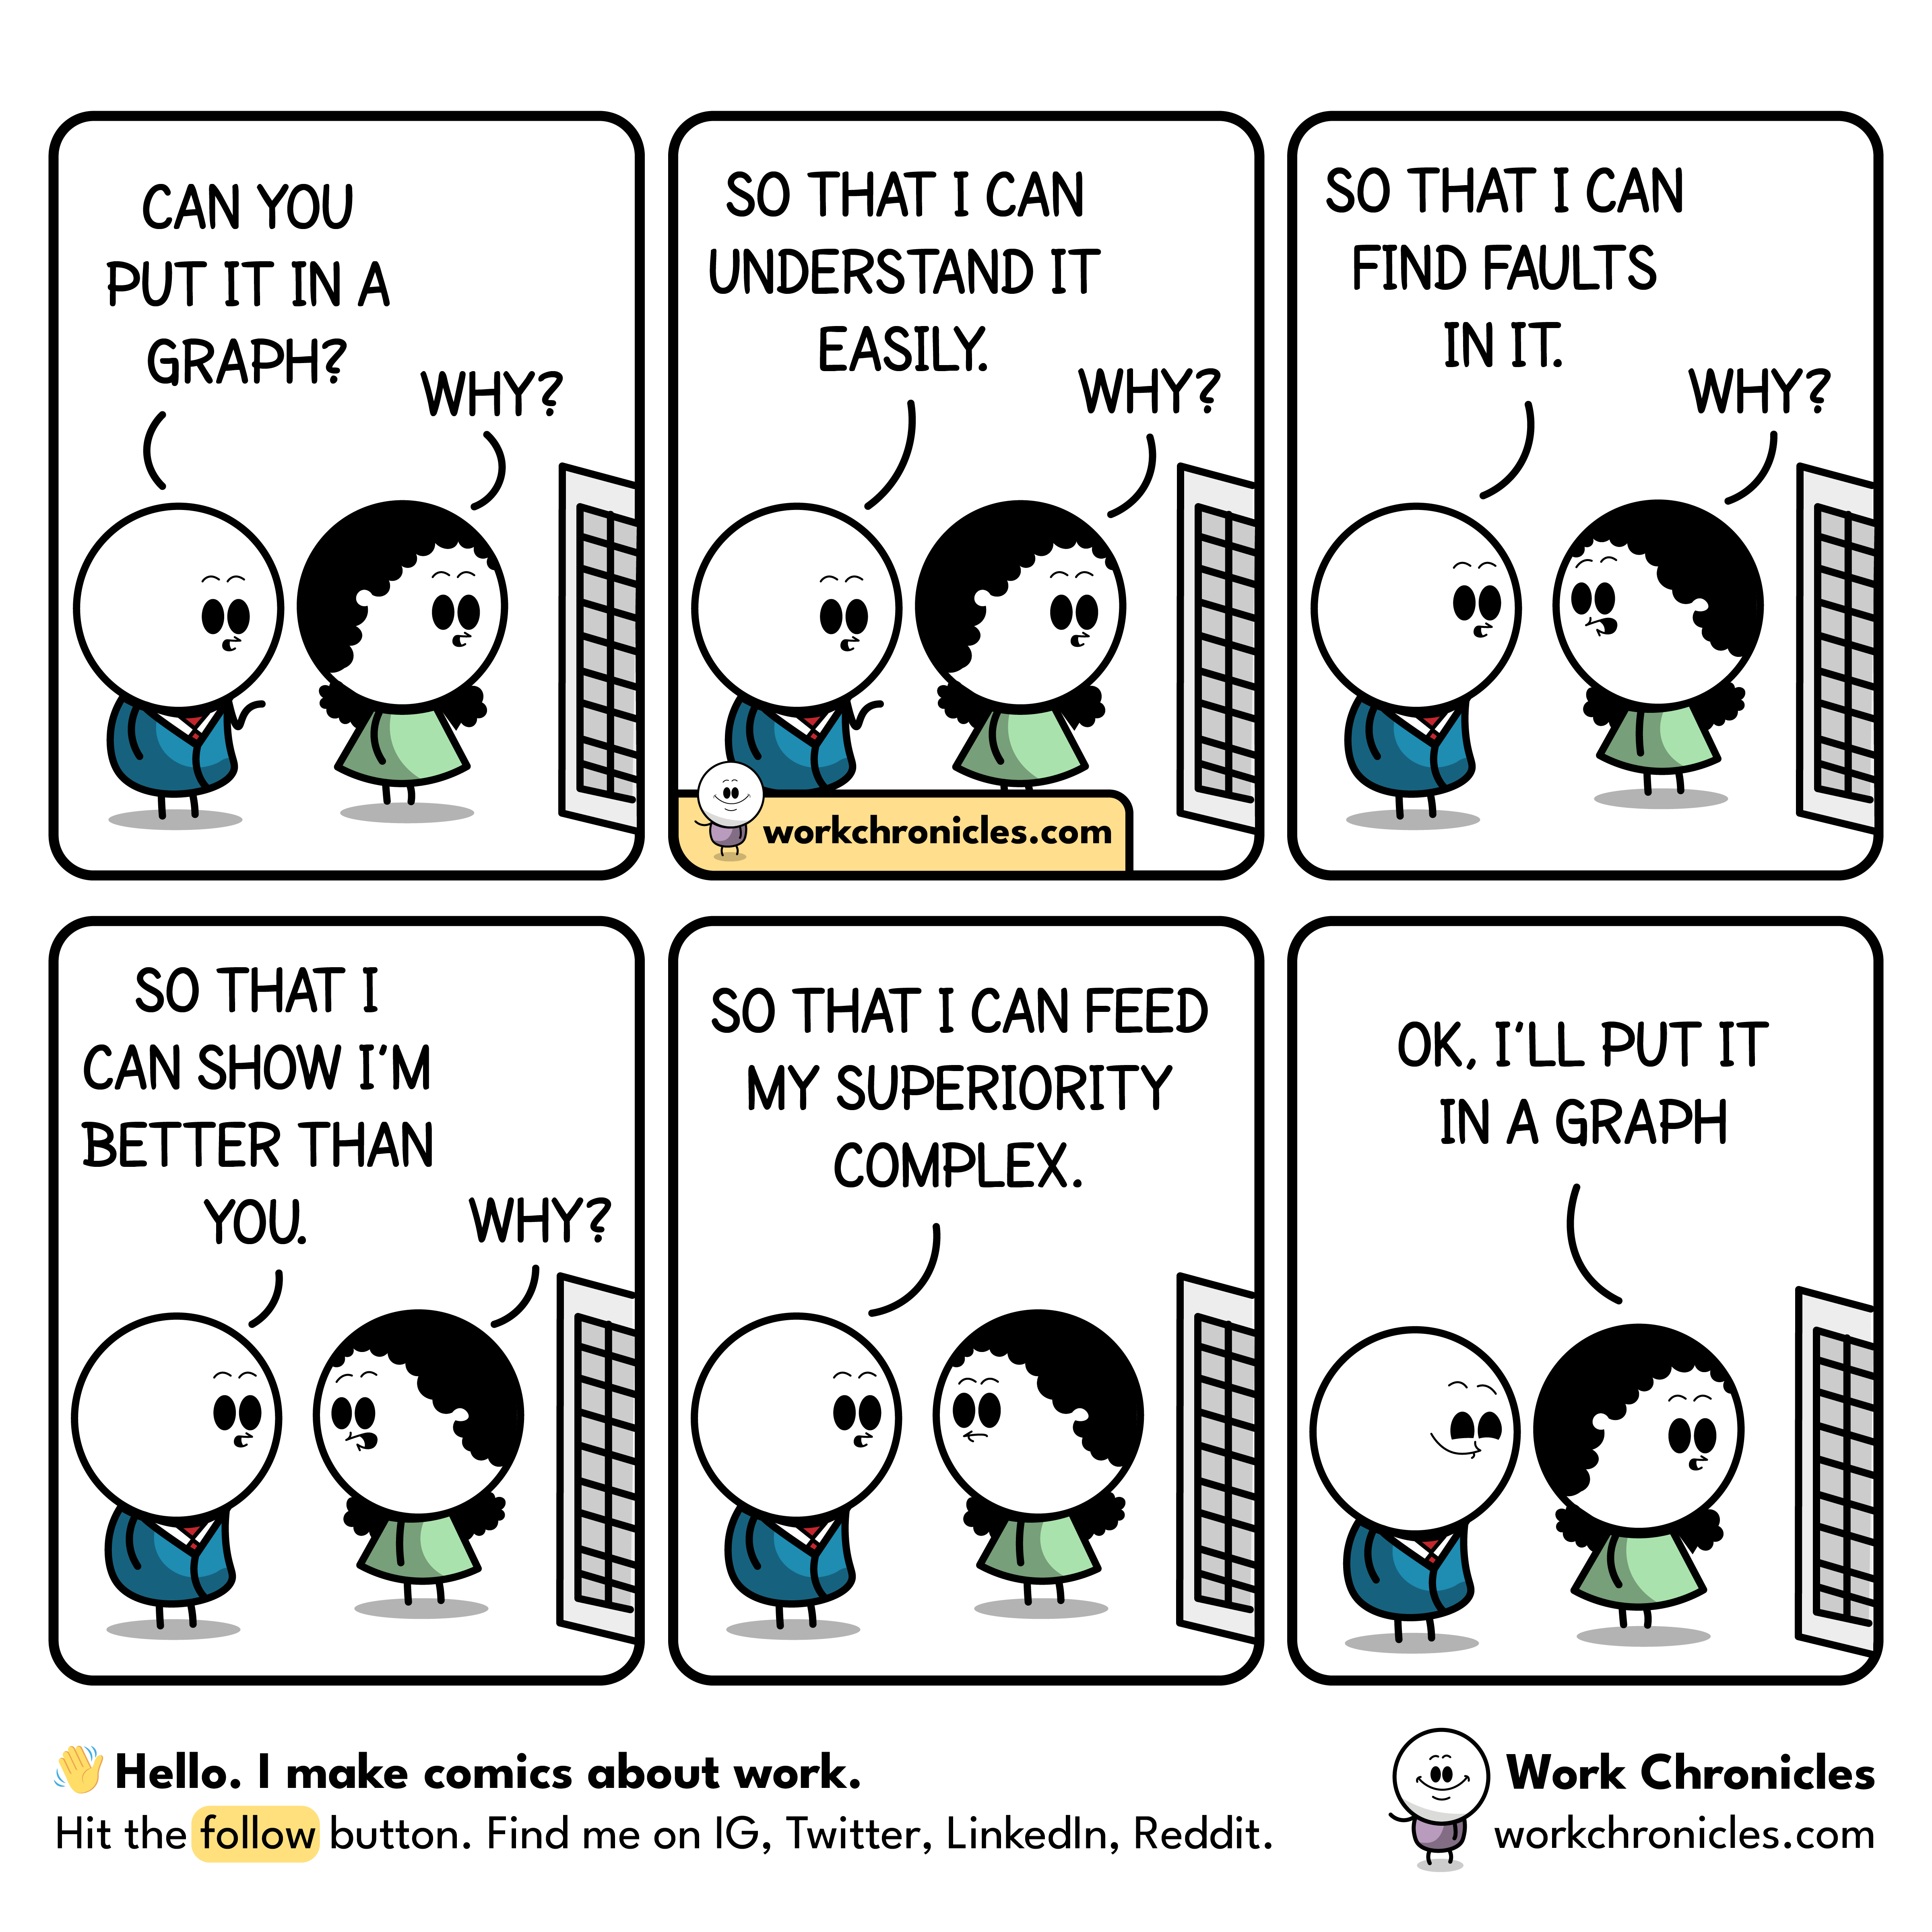
Maybe it depends on the domain, but I think it is perfectly reasonable both to ask or produce graphs to show data trends, qualitative behavior, relative rates, etc. I mean, looking at one chart and acting like you know better than the analyst might be a duck move but wanting the chart isn’t.
Imagine if scientific papers didn’t use plots to visualize data?